
Agile Metrics Sin #1: Using measurement as a lever to drive someone else’s behaviour
Do you use agile metrics as a feedback to improve? Or do your metrics end up influencing other's behaviours, often in unwanted fashion?

This is the first article of a 7-part series of “Revisiting seven deadly sins of agile measurement”. Original paper titled “Seven Deadly Sins of Agile Measurement” was authored by Larry Maccherone.
With the advent of data and data analysis, and an immense amount of inspiration from manufacturing industry alone, software engineering continues to employ a plethora of measures to seek the answer to “how efficiently do we build our softwares”? Agile pledges to continue to uncover better ways of writing software. And with uncovering of “better ways” arises an innate question of “Are we doing better and if yes, how do we quantify it?”
Agile itself has been interpreted in various ways, Larry writes —
“Agile can be perceived in different ways: as a manifesto of values or list of principles, as an emphasis on collaboration, as a repackaging of spiral and iterative development concepts, or as the overarching prioritisation of adapting to change over following a plan. I’ve been around software development long enough to see several of these shifts in perception and I’ve come to think about all such shifts as reactions to environmental changes, similar to what occurs in nature.”
With newer ways of working and emphasis on collaboration and early feedback, a lot of qualitative measurements were drawn in. But qualitative measurements are not effective, alone, in trying to collaborate with business owners. You can't walk upto your CEO and say “We should be pair programming as it yields better quality software as per our team”. This is (usually) not enough. You have to quantify it for them. They know better that just a qualitative feedback is not enough to take critical decisions. You have to bring in “Pair programming reduced the defects in software by 15% (hypothetical figure) last quarter, we should do it more often”. This lead to discovering of quantitative measures, clubbed with qualitative measures, to be able to seek the answer to “Are we really doing better than before?”.
Data analysis is like nuclear fission — use it well and it’s an evergreen source of valuable insights, use it wrong and it will cause havoc. As much as data can help in better decision making, it can also be evil and lead to malignant behaviour in teams and organisations. Larry identified that with data, there needs to be a necessary perspective shift in order to be use data as a boon, not bane.
“I have been working hard to identify the the key perspective shifts necessary to successfully introduce measurement into an Agile development environment, and I’ve coined the phrase, “Seven Deadly Sins of Agile Measurement” to capture this learning.” — Larry Maccherone
Let’s look at the first sin:
Sin #1: Using measurement as a lever to drive someone else’s behaviour
“If feedback emphasis is key to the success of Agile, the key to effective Agile measurement is to think of measurement in terms of feedback, not as the traditional lever to motivate behaviour. Using measurement as a lever often devolves into keeping score, which is where the dark side of measurement starts.” — Larry Maccherone
There is a subtle difference between a feedback and a lever:
“Feedback is something that you use to improve your own performance not to influence other’s behaviours. The difference is in how you use the measure more than the measure itself.”
Let’s take the example of your smart watch; that you wear every day. You need to check upon your daily steps count to make sure you’ve been active enough. You need this feedback to improve your overall wellbeing. You would never cheat on these figures with yourself. If you’ve done lesser steps than you aimed for, you will try to do more tomorrow. If you did more steps, you will reward yourself and ask “Can I do even better?”. Now imagine your company is “celebrating a wellbeing month”. To help spread the awareness and healthy habits, the company decides to reward the employee who does the maximum number of steps over the period of the month. Will you cheat now? Quite a few would — they would tie up the smart watch to their dogs, try ceiling fans or even put them in drier to maximise the steps. Btw these solutions are not made up, people have actually employed them. Anyways, can you see how people’s behaviour got influenced? Even when the intention of the company is absolutely pure and selfless. This is how the same data measurement can either behave as a feedback, or as a lever.
Let’s take the example of an average cycle-time plot of user stories presented in the paper. Every dot represents a user story, the higher the dot is on the plot, the longer it took for the user story to get delivered. The red line denotes the “control line”, meaning anything higher took more than ideal time to get delivered. The red dots represent such outlier user stories.
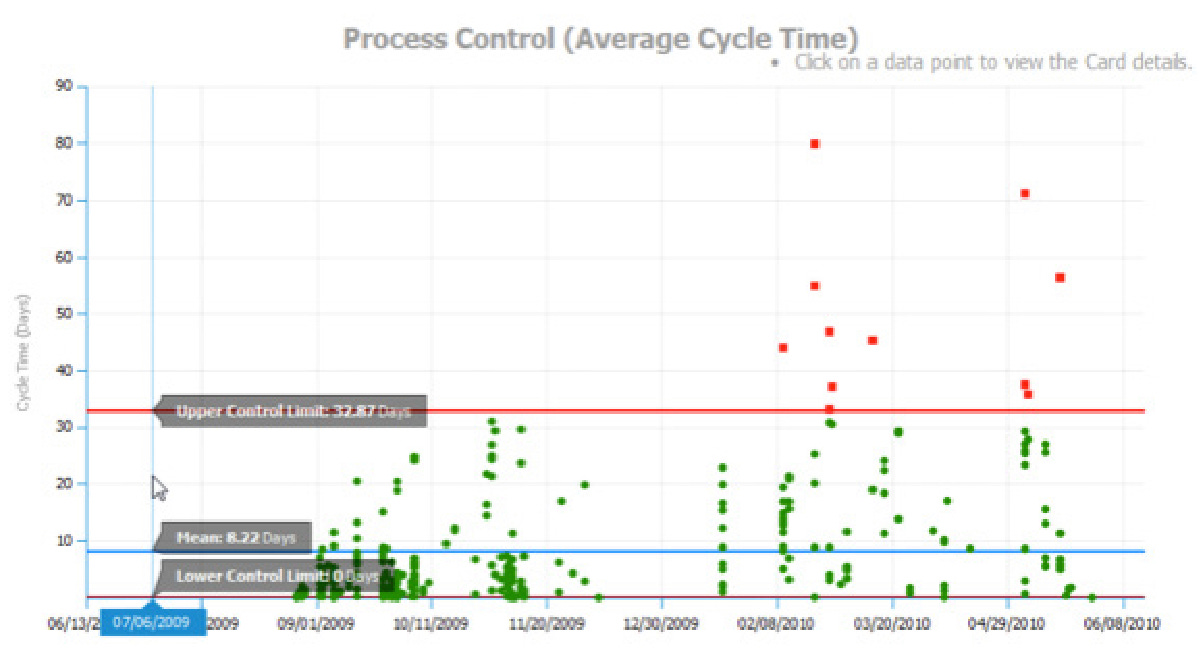
Larry mentions how such charts can lead to gamifying of the system and hiding the actual data which the team embarked in the first place to seek.
“What’s going to happen the next time you show this chart? There probably will be fewer red dots, but why? I’d like to think it will be because people have deeply analysed their process and made necessary changes, blah-blah-blah ... but what’s more likely is that they will just game the system to make sure they don’t have any red dots. Maybe they’ll split stories artificially instead of where they deliver value. This is bad because it’s wasteful and doesn’t improve the process; but what really hurts is that you’ve now hidden data from yourself. You’re making decisions with a distorted picture of reality.”
Replace the above with any similar metric, say your sprint-burndown chart which has that “ideal burndown line” for that matter — the result is going to be similar.
There are three laws at play now:
Measures tend to be gamed when used for target-setting — Campbell’s Law
The more any quantitative social indicator is used for social decision-making, the more subject it will be to corruption pressures and the more apt it will be to distort and corrupt the social processes it is intended to monitor.
The team did not achieve a better lead-time. Instead they gamed it to achieve the target (to be below the red line). Splitting a story artificially into multiple stories doesn’t deliver more value to the customer. Neither does by increasing story points to game your velocity. These are false positives.
When a measure becomes a target, it ceases to be a good measure — Goodhart’s Law
The cycle-time measure has become a waste now. What the team set out to achieve has gone in vain. Instead they are running after a pseudo target — to not let their stories cross the red line. In doing so, the actual data has been hidden from the team. The team’s opportunity to discover the various constraints in the system is lost. With this lost opportunity, the team stands little chance to improve their processes and channel their efforts productively.
Individuals will modify an aspect of their behaviour in response to their awareness of being observed — Hawthorne Effect.
Upon being held accountable for the outliers in lead-time plot, the individuals will naturally try to protect themselves. They would give more story points to the story. They would resist in trying new things, say to introduce a new testing strategy or discover a better design pattern — because they need to deliver fast. Do you think the team stands a fair chance of a good introspection, let alone improvement?
Inspire Pull and Resist the Push.
Larry states an alternative:
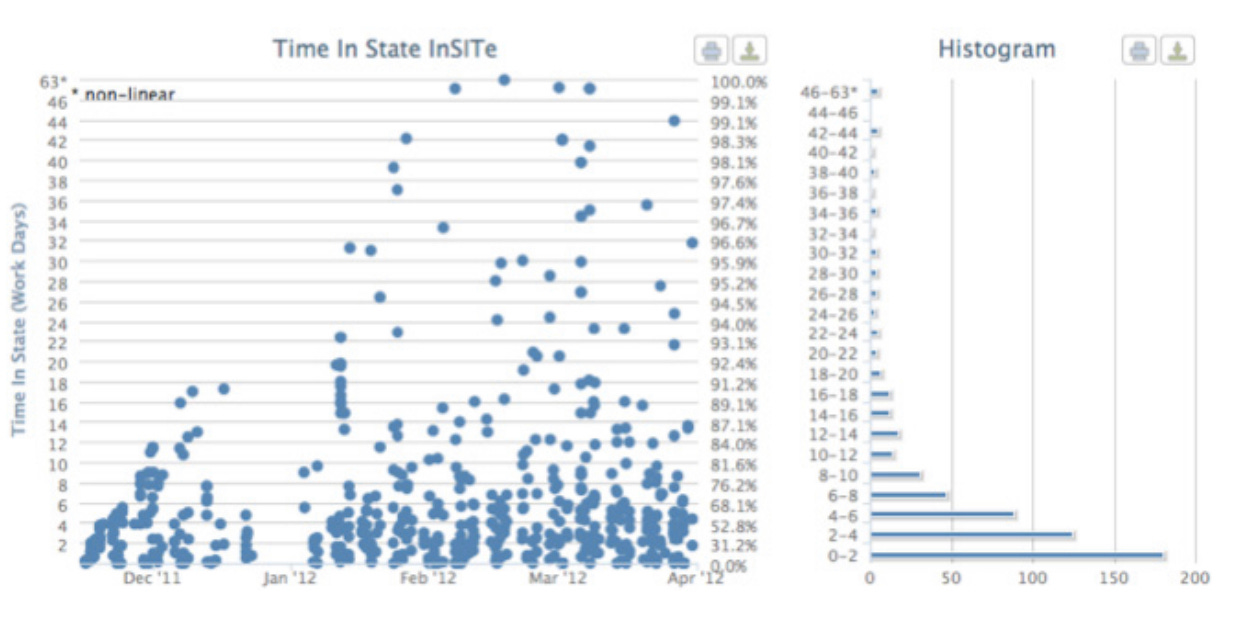
“As an alternative, I propose this chart:
It’s conceptually very similar to the first chart. The primary difference
is the lack of a red line and red dots. This visualization is designed to allow teams to explore their evidence, enabling learning and improvement. You can hover over a dot and get the details about what happened, which should enable discussion. You can talk about probabilities to help gauge risk. You’ll see that 95% of all stories finish in 28 days; maybe that will help you make a service-level agreement commitment.So, the heavenly virtue here is to inspire pull and resist the push. Use metrics as feedback to improve yourself: never as a lever to alter someone else’s behavior.”
The above is a Time in State chart which shows you how long your tasks stay in each step of your workflow on their journey to completion. It is a mighty chart to have in hand when you want to understand how quickly your tasks are completed and whether there are bottlenecks in your workflow.
Software development has lots of steps and handshakes in between. Typically, a story would get groomed and would be ready for development. Developers will work on the story and (usually) raise a PR for the changes to get merged. One or two reviewers would review the code and sometimes ask for a bit of changes to be made. After the changes, the story would be tested by the QA team. If found acceptable, the build would be shipped to production, if not it will have to be sent back to development for rework.
Every step is a handover, from one person (or a team) to another. Every handover has a wait time and a processing time — imagine every step as a processor which takes x amount of processing time to work on the item and while it is working, there would be work items that will wait for y units of time in the queue to be eventually picked up for processing. The overall cycle time would be a summation of such x(s) and y(s). Every now and then one or more such handovers become a constraint in your system. It is more important to focus on the constraint, rather than trying to locally optimise (or gaming things).
A good metric helps uncover such constraints. A good metric helps team retrospect and think. A good metric helps supporting or refuting a hypothesis. A good metric helps in making improvements and increases flow efficiency.
A good measure inspires pull and resists push!
In the next article in this series, we’ll discuss Sin #2 — Unbalanced Metrics. We’ll look at why is it important to have a balanced metrics scheme. And why it is imperative to measure other aspects of software engineering — not just productivity, but also customer satisfaction, quality, employee satisfaction etc.
Notes
Theory of Constraints - The Goal, Critical Chain, The Unicorn Project
Lean Methodology - The Lean Startup
Flow Efficiency - Hakan Forss: Flow Thinking